
Setup MQTT Broker, IoT Devices and Security
Intro
Some time ago I heard an interesting talk: The S in IoT stands for Security.
There is no ‘S’ in IoT? Correct, and exactly this is very often the problem. Even if you think “My IoT devices are all behind my firewall, I’m safe”: No, because most attacks happens from inside the network, by malware, social engineering attacks, unhappy employees or bad friends, …
So my goal is, to setup my MQTT broker which is as safe as possible. So you need to authenticate the client to publish or subscribe to topics. And of course we don’t want that the password is transferred in plaintext over the network, so we provide TLS encryption.
Knowing about the problem, that most of my IoT devices are not able to use TLS 😒 (especially my Shelly devices), the challenge is to setup the MQTT broker in a way that it works with TLS and without. And additional it is necessary to put this IoT devices into a separate network, where nobody else has access too.
Design
In the last blog I talked already how to setup Prometheus & Grafana as containers, now I need a MQTT broker, since Prometheus is not able to scrape most of my IoT devices. Again, the MQTT broker should run in a container like Prometheus and Grafana, managed by podman kube and run of course on openSUSE MicroOS .
So the big picture is, depending on the device:
- IoT device sends data to the MQTT Broker
- a process collects the messages and exports them as metrics for Prometheus
- a process collects the messages and stores them in a timeseries database like InfluxDB
- Grafana uses Prometheus and InfluxDB as datasources
Why Prometheus and InfluxDB? Many of my devices send only a new MQTT message with new values, if the difference to the old value is big enough. This can take several hours (or even days), something where I have big problems to handle that with Prometheus, which scrapes the metrics in a regular interval. In my experience, InfluxDB is also better suited if you want to measure the power created by our balcony power plant.
Setup
I used Mosquitto as MQTT Broker. The mosquitto process does not run as root, but a special user in the container, like we had already with Grafana. So let’s create a system user for this user ID, so that it does not come to a clash and somebody else is allowed to read and modify the MQTT data:
useradd -u 1883 -r mqtt -d /srv/mosquittoFor the certificate I use Let’s Encrypt , since I had already one for the machine. Not using a self signed certificate has the advantage, that the possibility that an IoT device will accept it is much higher. Else you need to teach the IoT device about your own key so that it trust it.
My directroy structure looks like:
/srv/
  ├── mosquitto/config -> for configuration and password file
  ├── mosquitto/data/ -> for the persistent data
  ├── mosquitto/log/ -> for the log files
  └── certbot/... -> for the certificate
Configuration
My mosquitto configuration file /srv/mosquitto/config/mosquitto.conf looks like:
listener 1883

listener 8883
certfile /mosquitto/certs/live/mqtt.example.com/cert.pem
keyfile /mosquitto/certs/live/mqtt.example.com/privkey.pem
cafile /mosquitto/certs/live/mqtt.example.com/fullchain.pem

persistence true
persistence_location /mosquitto/data

log_dest stdout
log_dest file /mosquitto/log/mosquitto.log

connection_messages true
log_timestamp true

password_file /mosquitto/config/password.txt
It’s good to know, that the main directory of mosquitto inside the container is /mosquitto, so everything is mapped into subdirectories of that directory.
At first we listen to port 1883. This is the default port for unencrypted connections. 8883 is the standard port for TLS encrypted connections. So we need to specify, where to find the certificate to use for this. In my case, everything for this is stored in /srv/ceertbot/etc, so I mount this directory inside the container on /mosquitto/certs.
As I don’t want to loose data if I restart the container or reboot the server, I set persistence to true, which means all connection, subscription and message data will be written to the disk at the location specified by persistence_location.
The log messages are printed on stdout and in a log file, which can be found on disk in /srv/mosquitto/log.
To have an overview, who connects to the server, connections are logged, too.
The last entry is the password file.
MQTT user account with password
The MQTT broker should be configured to require client authentication via username and password, so that not everybody can connect to it. The username and password combination is transmitted in clear text, that’s why it is so important to secure the connection with TLS (see above).
However having username/password authentication does provide an easy way of restricting access to the broker.
The username can also be used in restricting access to topics using an ACL (Access control list). For this reason it is important to not only generate one username/password pair, but devide your MQTT clients in usefull groups and give them an own username/password, depending on the access they really need.
To create accounts, we need to create at first an empty password file (we could let mosquitto_passwd do that, but if you call that several times to create different accounts, there is the risk to overwrite all existing entries). Afterwards we run mosquitto_passwd from the mosquitto MQTT container to create the entry. With this command, the file password.txt with the username/password pairs can be found in /srv/mosquitto/config/password.txt:
touch /srv/mosquitto/config/password.txt
podman run --rm -it -v /srv/mosquitto/config:/mosquitto/config docker.io/eclipse-mosquitto mosquitto_passwd /mosquitto/config/password.txt new_user
Password: <enter password>
Reenter password: <repeat password>
cat /srv/mosquitto/config/password.txt
new_user:$7$101$D5Vz+tneE24AWVvK$j5cYjVaIQnRnA5o75aqRwNrMCE740VMGB1Qtpr9irEehgb/rMLsbVAKVyncdGmqSL3v8L1b9c+IrtRIjRL0eAg==
Podman kube
For various features I need Podman as container runtime. Podman comes with a very nice feature: podman pod and podman kube , which uses kubernetes yaml files, at least if they don’t use too advanced features.
The mqtt.yaml for podman kube play file looks like:
apiVersion: v1
kind: Pod
metadata:
  labels:
    app: mqtt
  name: mqtt
spec:
  containers:
  - name: broker
    image: docker.io/eclipse-mosquitto
    ports:
    - containerPort: 1883
      hostPort: 1883
    - containerPort: 8883
      hostPort: 8883
    volumeMounts:
    - mountPath: /mosquitto/config
      name: srv-mosquitto-config-host-0
    - mountPath: /mosquitto/data
      name: srv-mosquitto-data-host-0
    - mountPath: /mosquitto/log
      name: srv-mosquitto-log-host-0
    - mountPath: /mosquitto/certs
      name: srv-mosquitto-certs-host-0
    resources: {}
    securityContext:
      capabilities:
        drop:
        - CAP_MKNOD
        - CAP_NET_RAW
        - CAP_AUDIT_WRITE
      privileged: false
  restartPolicy: unless-stopped
  volumes:
  - hostPath:
      path: /srv/mosquitto/config
      type: Directory
    name: srv-mosquitto-config-host-0
  - hostPath:
      path: /srv/mosquitto/data
      type: Directory
    name: srv-mosquitto-data-host-0
  - hostPath:
      path: /srv/mosquitto/log
      type: Directory
    name: srv-mosquitto-log-host-0
  - hostPath:
      path: /srv/certbot/etc
      type: Directory
    name: srv-mosquitto-certs-host-0
status: {}
This configuration uses the upstream mosquitto MQTT broker container. We open port 1883 for unencrypted MQTT connections and port 8883 for MQTT over TLS. Additional we have four volumes:
- for configuration and password file
- for persistent data
- for log files
- for the Let’s Encrypt certificates
That’s already all we need.
Run Containers
Now we just need to start the containers:
podman kube play mqtt.yamlThe command podman pod ps should show you at least one pod:
POD ID        NAME           STATUS      CREATED         INFRA ID      # OF CONTAINERS
3e2f71431b37  mqtt           Running     16 seconds ago  bb105b7a6122  2
Start container with every boot
While the containers are now running, we need to make sure that they will be started with the next reboot, too. For this, podman comes with a very nice and handy systemd service: podman-kube@.service.
This service will not only start the pod, but also makes sure, that the containers are current and update them if necessary.
The configuration file with complete path is passed as argument. The path needs to be escaped, but for this there is a systemd-escape.
So the final command to enable the systemd service would be:
systemctl enable "podman-kube@$(systemd-escape /<path>/mqtt.yaml).service"Configure IoT Device (Shelly Plug S)
We have a MQTT broker, now we need an IoT device, which sends something to it 😉 I used a Shelly Plug S for the beginning. Below “Internet & Security” and “ADVANCED - DEVELOPER SETTINGS” you can enable MQTT.
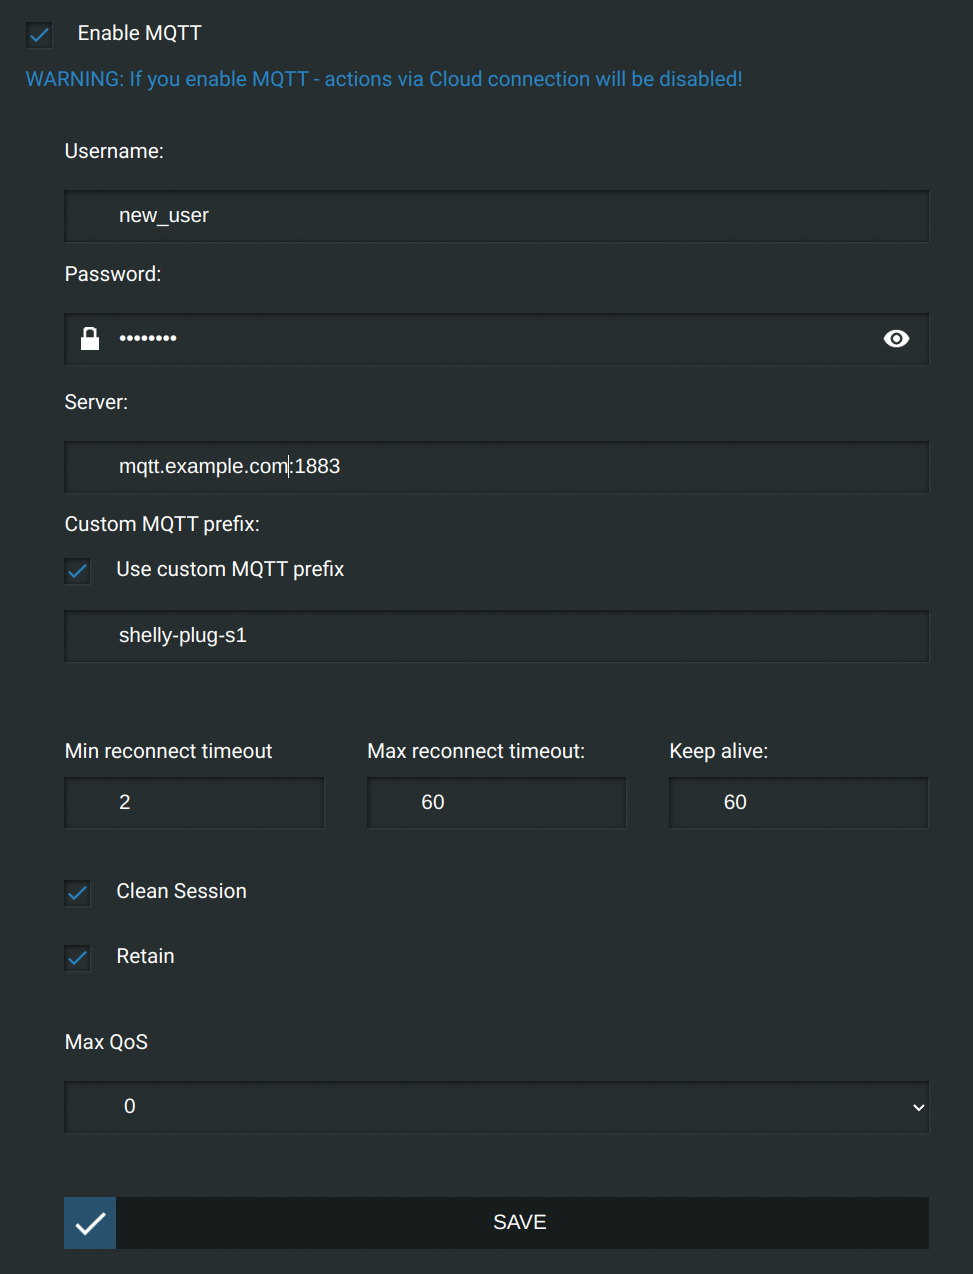
Fill out the following fields:
- Username: use the account you created before
- Password: the same, use as created above
- Server: the name or IP and port of your MQTT server
- Use custom MQTT prefix: for easier identification and better parsing of MQTT topics, I give all my IoT devices names which allows me to identify the device.
Test
Now, that we have a device sending MQTT messages, we should verify that they reach the MQTT Broker. For this we start a commandline tool and subscribe to the topics:
mosquitto_sub -v -h mqtt.example.com -p 8883 -t "#" -u <account name> -P <password>The -p 8883 port option means, we use MQTT over TLS. This is a good first test, if the certificate setup and configuration is correct. The -t "#" means, we subscribe to all topics.
Shortly you should see something like:
shellies/shelly-plug-s1/relay/0/power 20.59
shellies/shelly-plug-s1/relay/0/energy 61
shellies/shelly-plug-s1/relay/0 on
shellies/shelly-plug-s1/temperature 22.82
shellies/shelly-plug-s1/temperature_f 73.07
shellies/shelly-plug-s1/overtemperature 0
Which means: it’s working 😄
Outlook
In the next blogs I will explain how to setup an InfluxDB timeseries database, how to store the data in the database and how to visualize them in Grafana.