
Grafana with podman kube
Background
For a long time I have been using a containerized version of Munin to monitor some of my devices. But there are many things I can’t do with it and for many new tasks I would have to write code first, while there are often more than enough solutions for Prometheus and Grafana .
So far I have only used it for demos of openSUSE Kubic and openSUSE MicroOS at conferences and trade shows (like SUSECon19 ).
So time to modernize my monitoring in my home lab and use a containerized Grafana solution on Linux :)
The Linux OS: openSUSE MicroOS
All my servers run [openSUSE MicroOS] (https://microos.opensuse.org/)
, a fast, small environment designed for hosting container workloads with automated management and patching. As a rolling release distribution, the software is always up to date. For automatic updates, transactional-update
is used, which depends on btrfs subvolumes. This makes it possible to have a read-only root filesystem that is updated in the background so that the running process does not notice it. If something goes wrong, the new snapshot is deleted and it looks like nothing happened. If the updates could be installed without errors, the next time the system boots with the new snapshot. If the reboot fails, a rollback to the last working snapshot is performed automatically.
So there is no need to spend hours repairing the system after a faulty update 😃, which has already saved me several hours of work. And a special feature of transactional-update: all changes to /etc are also undone! On other systems with atomic updates this is usually ignored, because this directory is not part of the read-only OS image.
Another advantage of btrfs is that only the actual update changes are stored on disk, which is very space efficient. So you can save many old snapshots for a rollback or to create differences between snapshots to see what has really changed. So there is no massive waste of space like with an A/B partitioning scheme, no hard limit on old snapshots because you only have 2 or 3 partitions for them. The limiting factor is only the size of the disk and the size of the updates. I usually have about 20 snapshots on my system. And when they get too big, the system automatically cleans up and removes enough old snapshots.
Podman kube
For various features I need Podman as container runtime. Podman comes with a very nice feature: podman pod and podman kube , which uses kubernetes yaml files, at least if they don’t use too advanced features.
There are many docker-compose.yaml files out there, which start Prometheus and Grafana, but I don’t want python on my OS (in my opinion python is good for applications to run inside the container, but python is a really bad choice for system tasks on the OS itself), so I couldn’t use them. On the other side, the documentation about how to create yaml files for podman kube play are not really existing and partly very complicated. But in the end I managed to create a working yaml file:
# Save the output of this file and use kubectl create -f
# to import it into Kubernetes.
apiVersion: v1
kind: Pod
metadata:
  labels:
    app: monitoring
  name: monitoring
spec:
  containers:
  - name: prometheus
    image: docker.io/prom/prometheus:latest
    ports:
    - containerPort: 9090
      hostIP: 127.0.0.1
      hostPort: 9090
    resources: {}
    securityContext:
      capabilities:
        drop:
        - CAP_MKNOD
        - CAP_NET_RAW
        - CAP_AUDIT_WRITE
    volumeMounts:
    - mountPath: /etc/prometheus
      name: srv-prometheus-etc-host-0
    - mountPath: /prometheus
      name: srv-prometheus-data-host-0
  - name: grafana
    image: docker.io/grafana/grafana:latest
    ports:
    - containerPort: 3000
      hostIP: <your external host IP>
      hostPort: 3000
    resources: {}
    securityContext:
      capabilities:
        drop:
        - CAP_MKNOD
        - CAP_NET_RAW
        - CAP_AUDIT_WRITE
        - CAP_AUDIT_WRITE
      privileged: false
    volumeMounts:
    - mountPath: /var/lib/grafana
      name: srv-grafana-data-host-0
  restartPolicy: unless-stopped
  volumes:
  - hostPath:
      path: /srv/prometheus/etc
      type: Directory
    name: srv-prometheus-etc-host-0
  - hostPath:
      path: /srv/prometheus/data
      type: Directory
    name: srv-prometheus-data-host-0
  - hostPath:
      path: /srv/grafana/data
      type: Directory
    name: srv-grafana-data-host-0
status: {}
The <your external host IP> needs to be replaced with the host IP on which the grafana dashboard should be later accessible. Or localhost, if it should not be reacheable via the network.
This yaml file starts three containers:
*-infra- this is a podman helper containermonitoring-prometheus- this is the prometheus containermonitoring-grafana- this is the grafana container
Important to know: localhost is inside the POD identical for all containers. So grafana in the one container can connect via http://localhost:9090 with the prometheus container, and every process on the host can access e.g. prometheus via http://localhost:9090, too. But this is not valid for other PODs or in general for all containers outside the PODs: as they have their own localhost, you can only access them via the external network interface of the host, or if you do a more complicated network setup. The later one is still on my TODO list, but since podman announced to discontinue the currently used CNI network stack and wants to switch to their own, I’m waiting for that.
Directory layout, Configuration files and Permissions
But before we can start the containers, we need to create the necessary directories, to store the configuration files and persistent data. The directory layout looks like:
/srv/
  ├── prometheus/etc/prometheus.yml -> the prometheus configuration file
  ├── prometheus/data/ -> for the persistent database
  └── grafana/data/ -> for the persistent grafana data
Beside the existence of the diretories, the owner ships is as important. Prometheus writes as user nobody:nobody into /srv/prometheus/data, so this user needs write permissions. This is already a very big security design flaw, the user nobody should have never write rights anywhere. So make sure, that really nobody is allowed to look into the /srv/prometheus directory struct. Best is to do
chmod 700 /srv/prometheusGrafana is here better, it runs by default with the user ID 472. So make sure that nothing is using this ID on your system and create a grafana system user for the data ownership:
useradd -u 472 -r grafana -d /srv/grafana/dataThis command will create a system account grafana with the user and group ID 472. Afterwards we made sure that the grafana data directory is owned by this user, so that the grafana process can write into it:
chown grafana:grafana /srv/grafana/dataAt least we need a configuration file for prometheus. For the start, we monitor prometheus itself:
global:

scrape_configs:
  - job_name: 'prometheus'
    static_configs:
    - targets: ['localhost:9090']
This config (stored as /srv/prometheus/etc/prometheus.yml) is very simple: we don’t change any global defaults and tell prometheus, to scrap localhost:9090 (so itself) every 60 seconds (which is the default) and store it as prometheus.
Done!
Run Containers
Now we just need to start the containers:
podman kube play monitoring.yamlThe command podman pod ps should show you one pod:
POD ID        NAME        STATUS      CREATED         INFRA ID      # OF CONTAINERS
63b242775da6  monitoring  Running     39 minutes ago  0e6192eb180c  3
The command podman ps will show you the three containers:
CONTAINER ID  IMAGE                                    COMMAND               CREATED         STATUS             PORTS                                             NAMES
0e6192eb180c  localhost/podman-pause:4.3.1-1669075200                        39 minutes ago  Up 39 minutes ago  127.0.0.1:9090->9090/tcp, 0.0.0.0:3000->3000/tcp  63b242775da6-infra
d9bbdaf48eb8  docker.io/prom/prometheus:latest         --config.file=/et...  39 minutes ago  Up 33 minutes ago  127.0.0.1:9090->9090/tcp, 0.0.0.0:3000->3000/tcp  monitoring-prometheus
96a3e9486239  docker.io/grafana/grafana:latest                               39 minutes ago  Up 35 minutes ago  127.0.0.1:9090->9090/tcp, 0.0.0.0:3000->3000/tcp  monitoring-grafana
Start container with every boot
While the containers are now running, we need to make sure, that they will be started with the next reboot, too. For this, podman comes with a very nice and handy systemd service: podman-kube@.service.
This service will not only start the pod, but also makes sure, that the containers are current and update them if necessary.
The configuration file with complete path is passed as argument. The path needs to be escaped, but for this there is a systemd-escape.
So the final command to enable the systemd service would be:
systemctl enable "podman-kube@$(systemd-escape /<path>/monitoring.yaml).service"Setting up Grafana
Now we can connect to the grafana dashboard using the url http://<hostname>:3000:
The grafana container comes with a default login:
- User:
admin - Password:
admin
Grafana enforces a password change at the first login for this reason.
Before we can see the first data, there are two important steps to do:
- Configure prometheus as Datasource
- Create a dashboard for prometheus
Adding prometheus as datasource is simple:
- Select DATA SOURCES and afterwards Prometheus.
- Enter
http://localhost:9090in the HTTP URL field. Remember, this are thehostIPandhostPortfields for the prometheus container in the yaml file. - Go to the end of the page and select Save & test.
This should give you a “Data source is working” message.
Select the grafana logo in the upper left corner to come back to the main screen, now we need to add a dashboard. Since we want to use an existing one and don’t create a new one, we do not select DASHBOARDS, but the icon with the four squares on the left side. In the menu we go down and select Import.
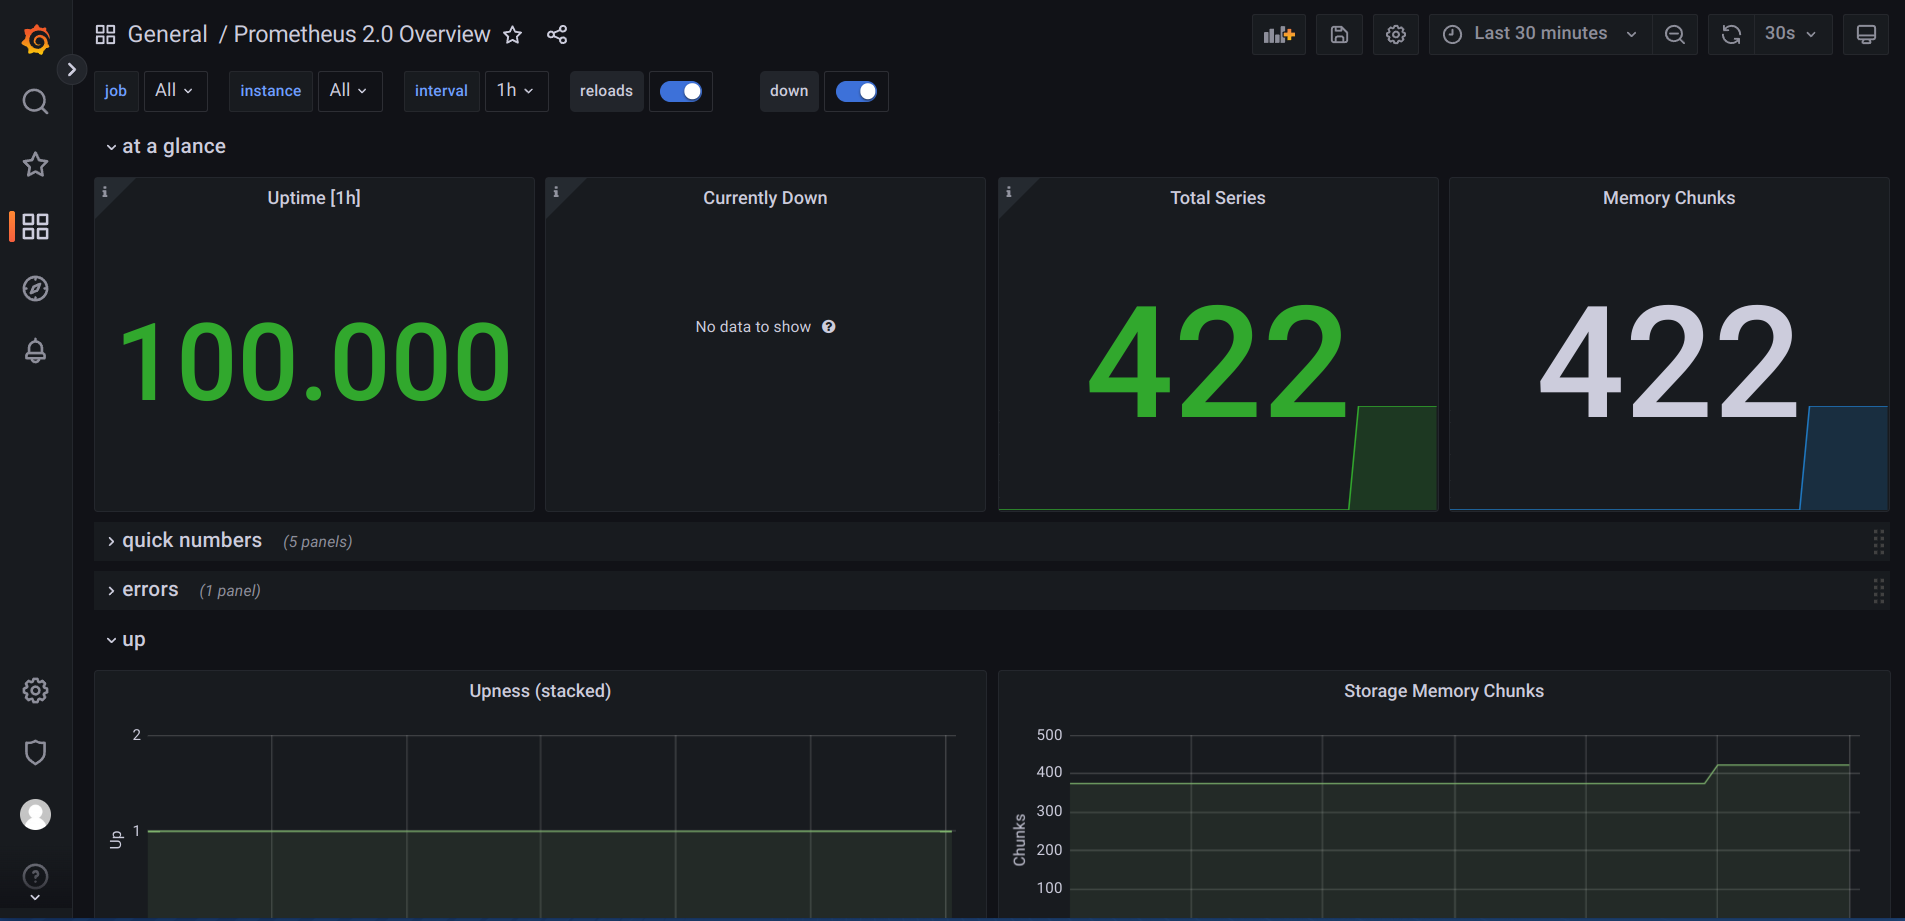
We Add the ID 3662 in the Import via grafana.com box and click on Load. This will import the Prometheus 2.0 Overview dashboard. But before we can finally import it, we need to select the datasource. On the next page, in the prometheus dropdown box, select Prometheus (default) and click on Import.
Now you should see your first dashboard:
Deploying Node Exporter
Monitoring Prometheus itself is now not the most exciting tasks, much more important is to monitor your servers. The most common tool used here is Node exporter , which is a prometheus sub-project and exists also as container.
Podeman kube yaml file
At first, we need a new yaml file. We could add the container to the existing monitoring.yaml file, but since we want to install it on several servers, it makes sense to create a standalone version of it:
# Save the output of this file and use kubectl create -f
# to import it into Kubernetes.
apiVersion: v1
kind: Pod
metadata:
  labels:
    app: node-exporter
  name: node-exporter
spec:
  containers:
  - args:
    - --path.rootfs=/host
    image: docker.io/prom/node-exporter:latest
    name: node_exporter
    securityContext:
      capabilities:
        drop:
        - CAP_MKNOD
        - CAP_NET_RAW
        - CAP_AUDIT_WRITE
    volumeMounts:
    - mountPath: /host
      name: root-host-0
      readOnly: true
  enableServiceLinks: false
  hostNetwork: true
  volumes:
  - hostPath:
      path: /
      type: Directory
    name: root-host-0
Start Node Exporter
This time we don’t need to create any diretories or configuration files, so the command to enable and start the node-exporter is just:
systemctl enable --now "podman-kube@$(systemd-escape /<path>/node_exporter.yaml).service"Add Node Exporter to Prometheus
To teach Prometheus about Node Exporter, we need to add the following lines at the end of the /srv/prometheus/etc/prometheus.yml file, so in the scrape_configs section:
  - job_name: 'node'
    static_configs:
    - targets: ['server1.example.com:9100']
    - targets: ['server2.example.com:9100']
We will not create an own entry for every host, instead there will be one node entry, and every host to scrape the metrics from is added as target.
We only need to restart prometheus to make it aware of the config file change:
podman restart monitoring-prometheusAdd Node Exporter Dashboard to Grafana
Now we will import that grafana dashboard with the ID 13978 like the first dashboard and you should see something like the following:
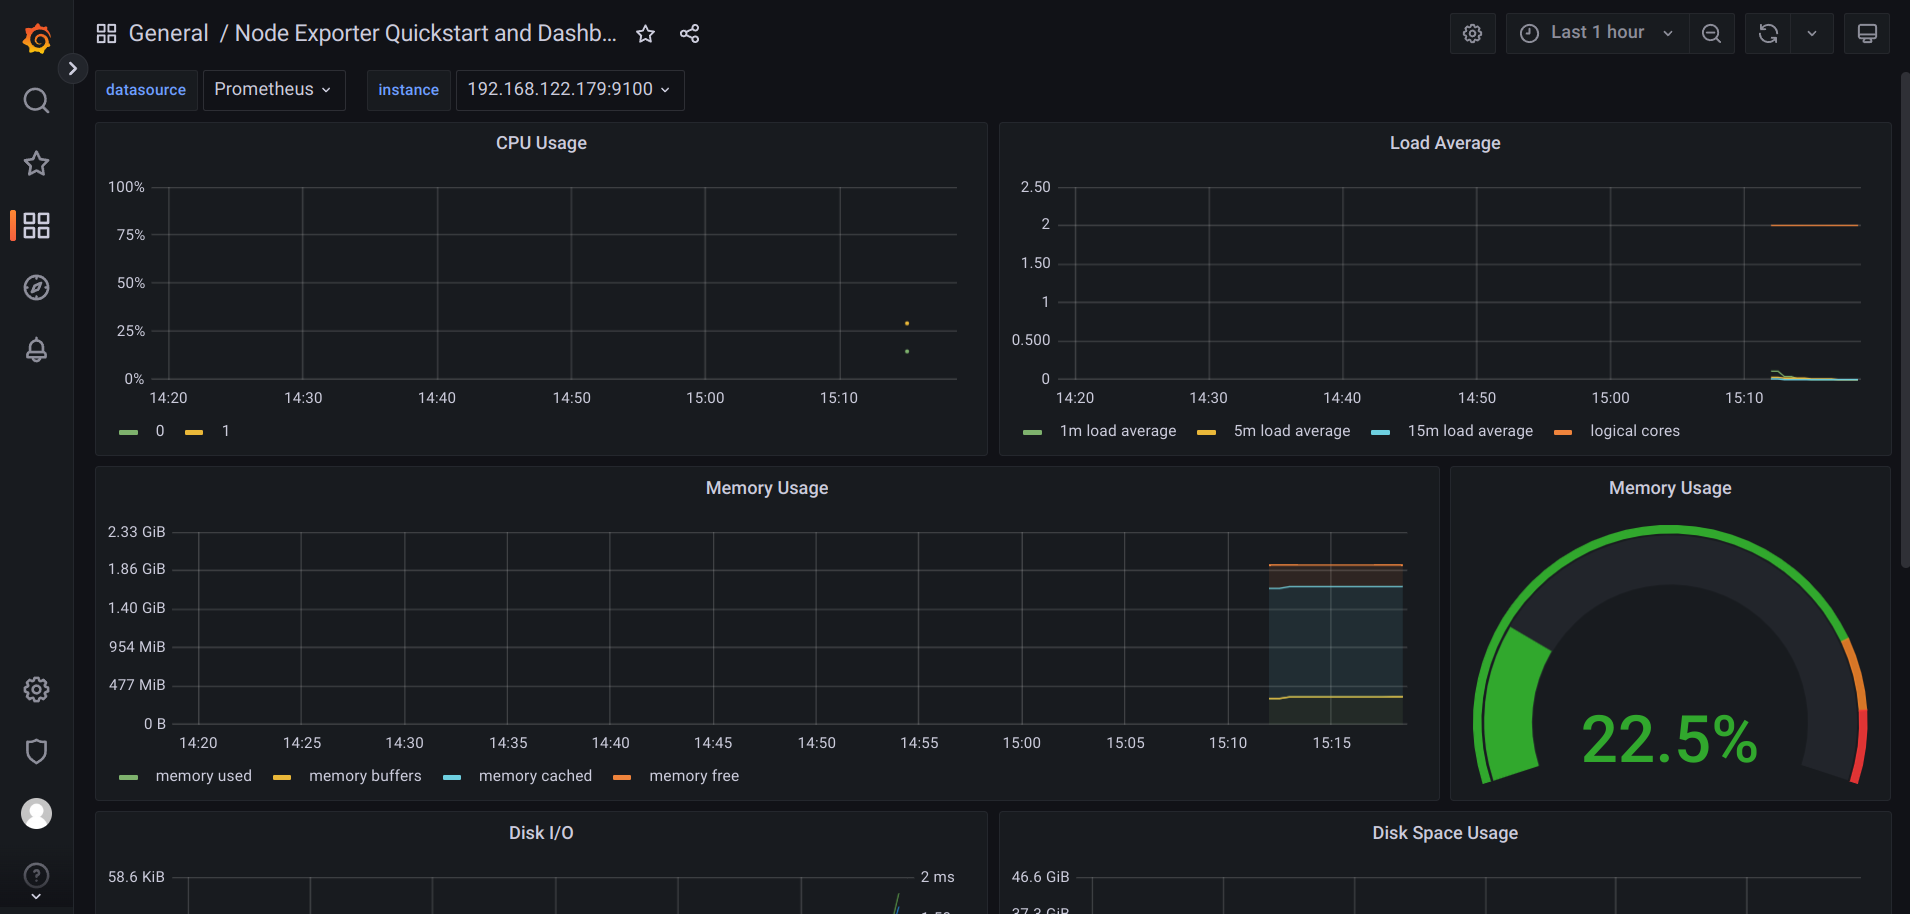
Completed
That’s it for now.
In the next blogs of this series I will explain how to monitor the Fritz!Box including the Smarthome devices (which I use to monitor my balcony power plant) and various IoT devices (power metering and temperature) with Prometheus, InfluxDB and an MQTT broker.